
By Dr. James Rogers
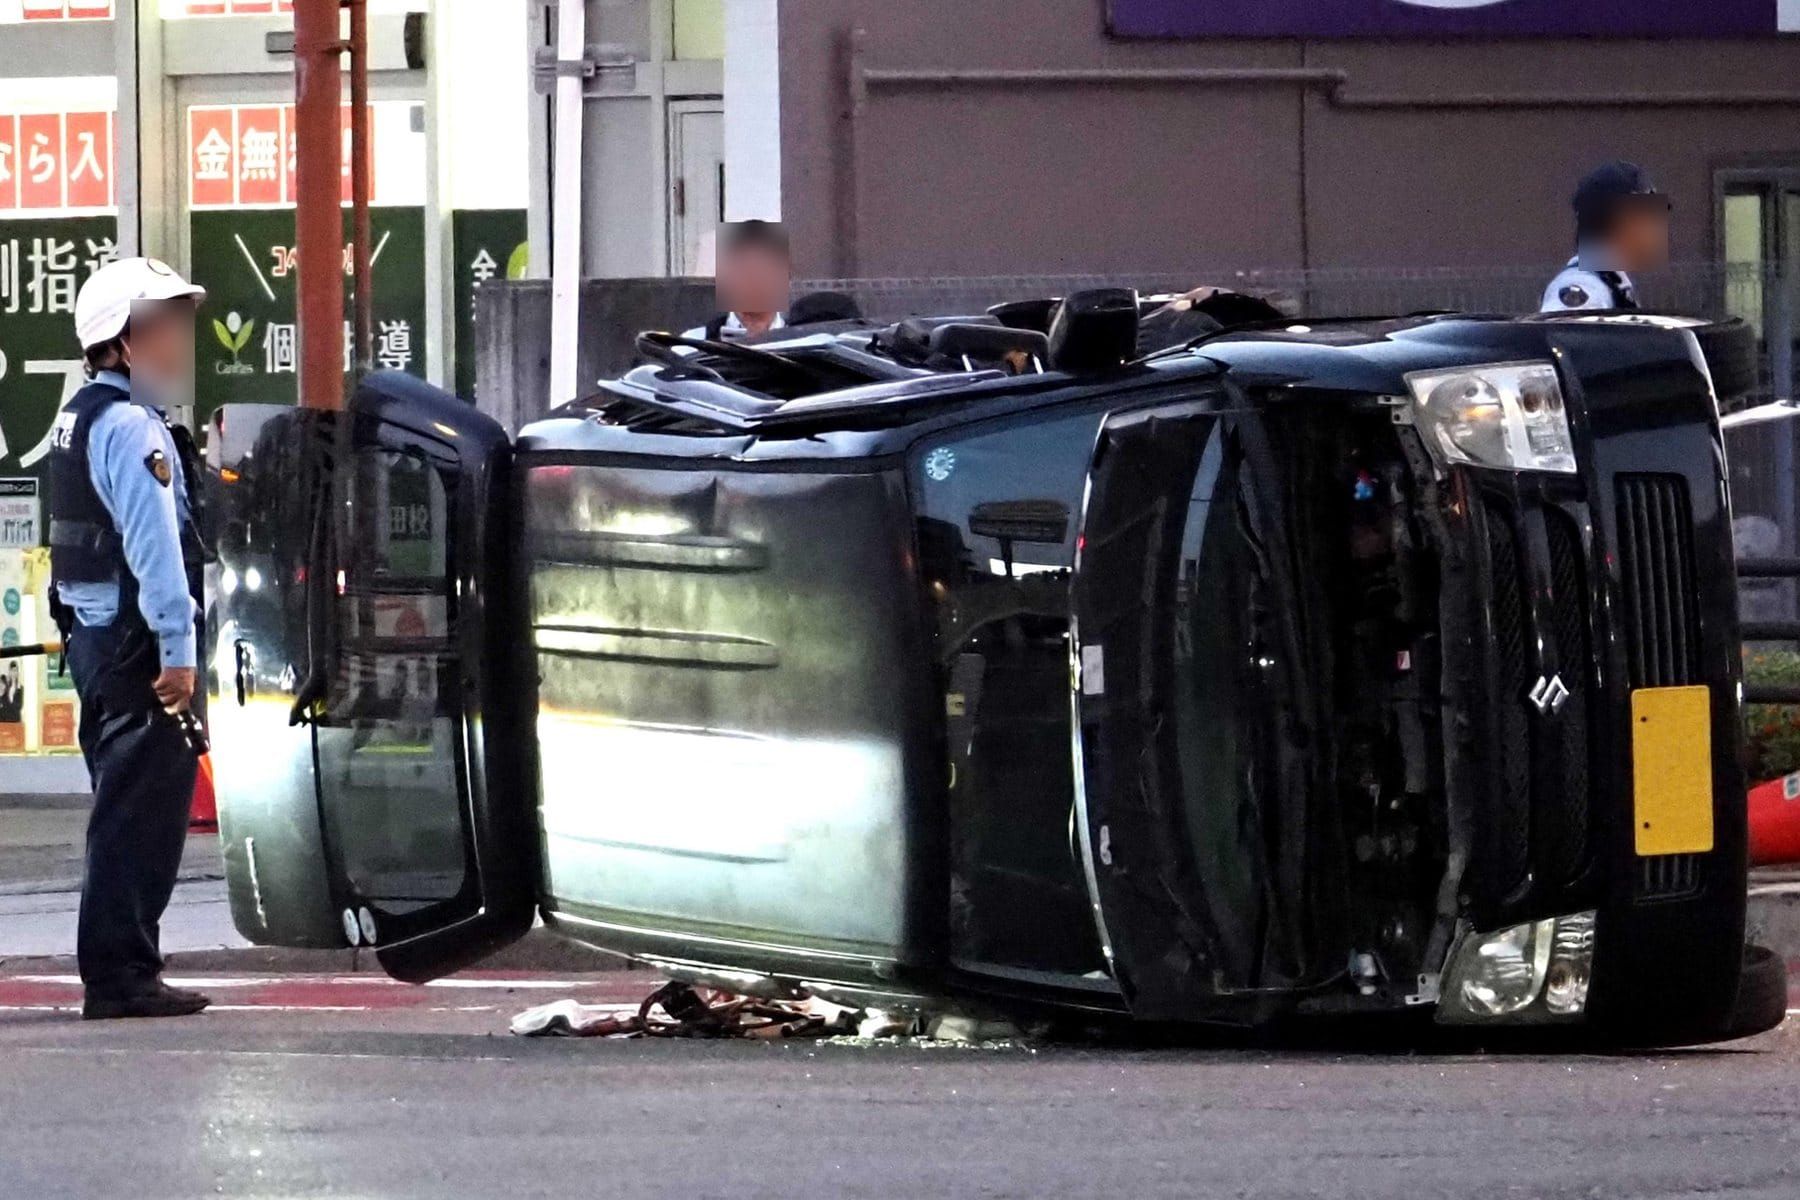
Aichi is notorious in Japan for traffic accidents. For 16 consecutive years, from 2003 through 2018, it had the highest number of traffic fatalities of any prefecture. Frequent reporting of this statistic in the media may have contributed to the prefecture's reputation for dangerous driving. But is that reputation justified?
Aichi has more than 5.3 million registered vehicles, the largest total in Japan. Its capital, Nagoya, also has an extensive urban road network: 95.4% of its planned arterial roads had been completed as of March 2024. In comparison, Osaka City's completion rate is 81% as of April 2026, and for Tokyo's 23 wards it is 67.7% as of March 2025. Could it simply be that Aichi has more vehicles, and thus more accidents?
What the numbers say
According to the National Police Agency's annual fatality totals and the Japan Automobile Service Promotion Association's vehicle registration figures, Aichi had the lowest number of traffic fatalities per registered vehicle in 2025. Shiga had the highest. Fatal accidents have also dropped in Aichi over the last seven years. The prefecture went from the highest total in the nation in 2018 to seventh in 2025.
However, Aichi does rank somewhat high for accidents resulting in injury or death per registered vehicle, with the eighth-highest rate in Japan (see the table below).
| Rank | Prefecture | Accidents | Vehicles | Per 100,000 |
|---|---|---|---|---|
| 1 | Tokyo | 30,169 | 4,446,646 | 678.5 |
| 2 | Osaka | 25,048 | 3,844,738 | 651.5 |
| 3 | Shizuoka | 16,511 | 2,915,228 | 566.4 |
| 4 | Kanagawa | 21,307 | 4,079,701 | 522.3 |
| 5 | Gunma | 9,095 | 1,820,766 | 499.5 |
| 6 | Fukuoka | 17,367 | 3,490,273 | 497.6 |
| 7 | Hyogo | 14,454 | 3,064,678 | 471.6 |
| 8 | Aichi | 24,789 | 5,382,996 | 460.5 |
| 9 | Saitama | 15,621 | 4,237,563 | 368.6 |
| 10 | Saga | 2,363 | 692,314 | 341.3 |
Data sources: National Police Agency and Japan Automobile Service Promotion Association.
Nagoya's share
Large cities have many vehicles, pedestrians, and cyclists, creating an increased risk of traffic accidents. How does Nagoya compare with other major cities in its share of prefectural traffic accidents? Tokyo's 23 wards accounted for approximately 69.7% of accidents in Tokyo Metropolis, while Kyoto accounted for approximately 64.5% of accidents in Kyoto Prefecture. Nagoya accounted for 34.5% of Aichi Prefecture's reported accidents.
Does that mean that Tokyo and Kyoto are significantly more dangerous than Nagoya is? Not really. Tokyo and Kyoto make up much larger shares of their prefectures' populations than Nagoya does (see the table below). When you divide the accident share by the population share, Sapporo has the highest relative concentration, with a ratio of 1.29. It is worth noting that Nagoya does rank third, though.
| Rank | City | % of accidents | % of population | Ratio |
|---|---|---|---|---|
| 1 | Sapporo | 50.9% | 39.4% | 1.29 |
| 2 | Kyoto | 64.5% | 57.2% | 1.13 |
| 3 | Nagoya | 34.5% | 31.5% | 1.10 |
| 4 | Kobe | 28.7% | 28.1% | 1.02 |
| 5 | Osaka | 32.4% | 32.0% | 1.01 |
| 6 | Tokyo 23 wards | 69.7% | 69.8% | 1.00 |
| 7 | Saitama | 16.6% | 18.5% | 0.90 |
| 8 | Fukuoka | 29.4% | 32.7% | 0.90 |
| 9 | Kawasaki | 15.0% | 17.0% | 0.88 |
| 10 | Yokohama | 35.7% | 40.8% | 0.87 |
Data sources: e-Stat, Data Sanpo (population), and Data Sanpo (traffic accidents).
The center bus lanes
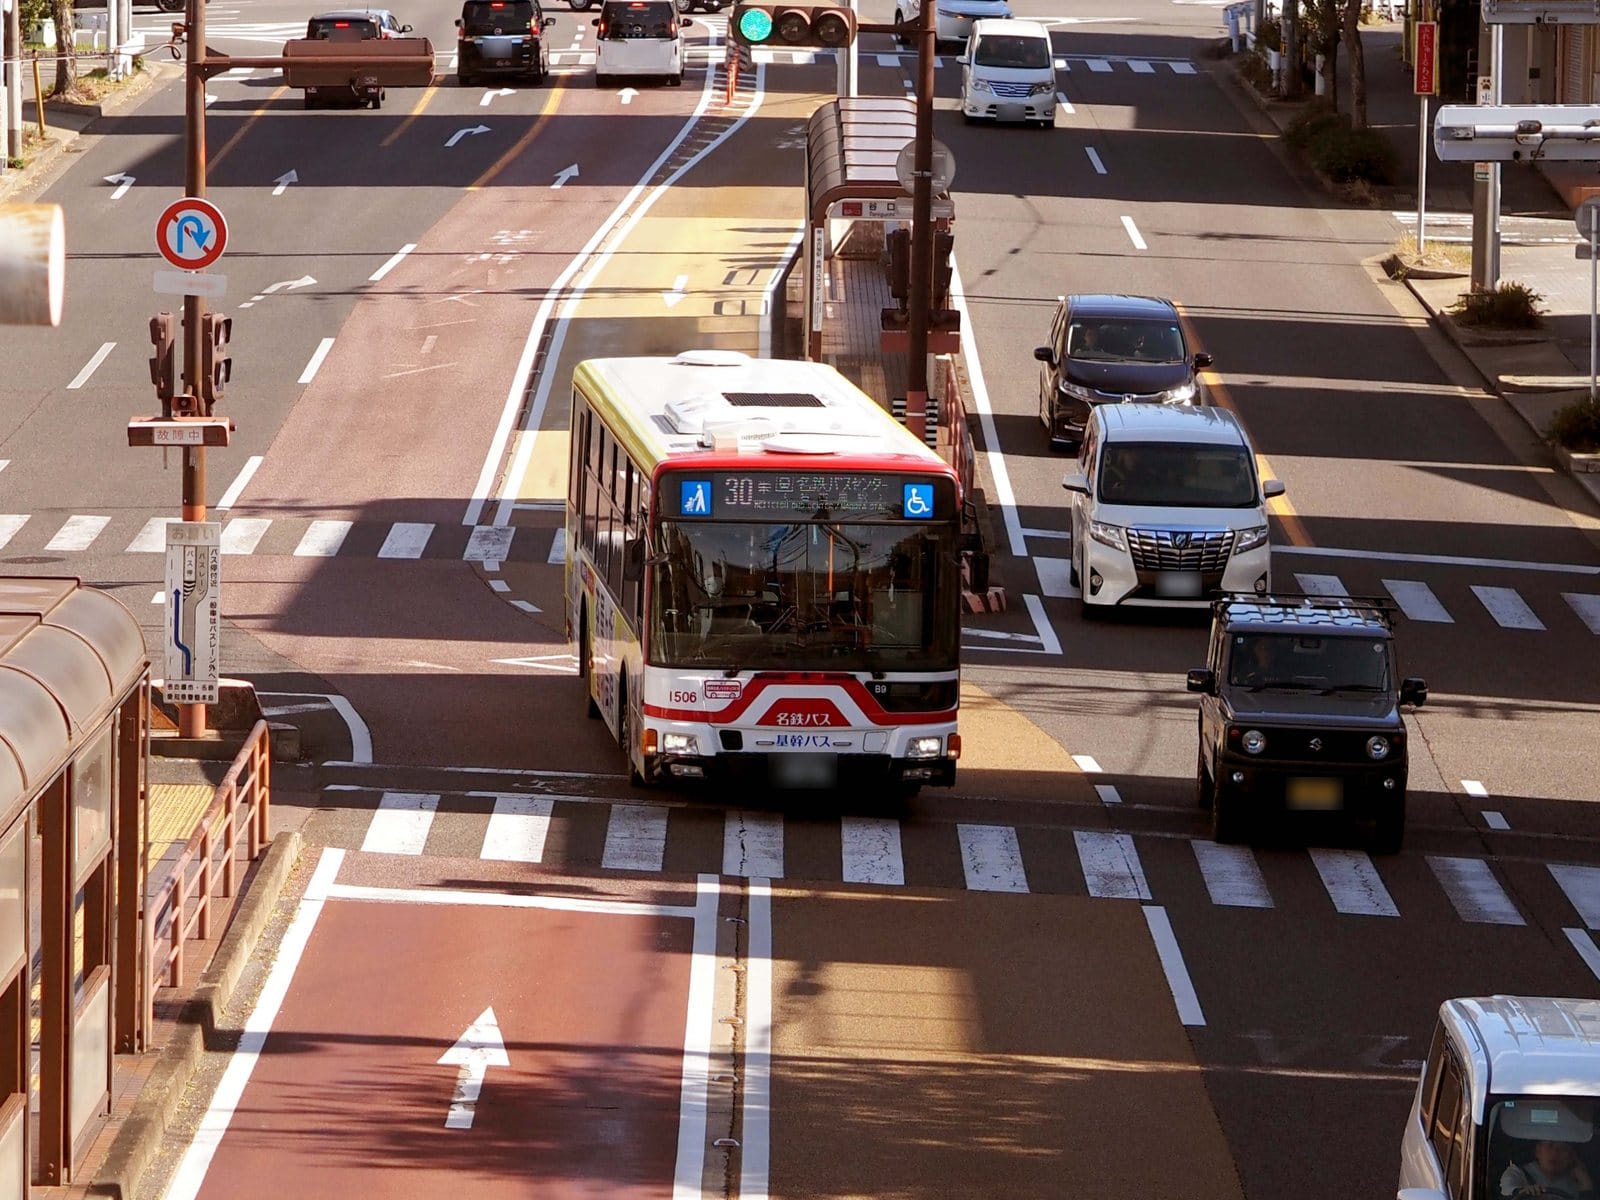
While the above data indicates that Nagoya is not the most dangerous city to drive in, visiting motorists do need to be aware of an unusual road design found in the city: its center bus lane roads, which run along a roughly 9 km stretch of the Key Route Bus line between Sakuradori-Otsu and Hikiyama. Nagoya is the only city in Japan that has such roads. They have bus lanes and stops in the middle of major roads. The first time I drove on one, I was completely shocked at how dangerous it felt. After 13 years of living and driving in Nagoya, I still feel uncomfortable driving on them.
Two features make this system hazardous. First, drivers turning right need to wait in a center lane while traffic continues on either side. This is highly counterintuitive and unusual compared to the typical road configuration across the country. A driver unfamiliar with the city could easily become confused and end up in a major accident. In a 2022 paper in the Journal of Traffic Engineering, the authors illustrated various scenarios that make this particular road design in Nagoya hazardous.
The other problem with these roads is that some sections have no physical separation between opposing traffic flows. As a result, you may pass very close to vehicles traveling in the opposite direction. What makes this significantly worse is that at nearly every stop, there is a bend in the road which corrects for the bus stop in the center of the roadway. It is a very short, sudden bend where you may speed right by another vehicle for a brief moment, and then have to correct back into the straight lane when the bend ends. When another vehicle passes by you on this bend, it is quite concerning. It is worse when that vehicle is a bus. In my experience, buses often cross briefly into the opposing lane, as their width and length make it hard to maneuver the bend. You have to be very alert when approaching this part of the road, and if you are going a bit too fast and don't expect it, it can be quite unsettling.
Nagoya Bashiri
Even though Aichi has the lowest ratio of accident fatalities per registered vehicle, repeated reporting of its historically high number of traffic fatalities appears to have reinforced its reputation for poor driving. But what do people in Aichi say about their own driving? Nagoya is infamous for "Nagoya bashiri" (Nagoya driving style). In a 2022 article, Yuma Narita explains that the term refers to the perception that Nagoya drivers tend to run red lights, drive aggressively, disregard pedestrians, and engage in similar dangerous driving behaviors. However, a J-Town Net article notes that many people in Aichi blame two areas near Nagoya for the prefecture's bad reputation: the city of Ichinomiya and the license plate jurisdiction of Owari-Komaki.
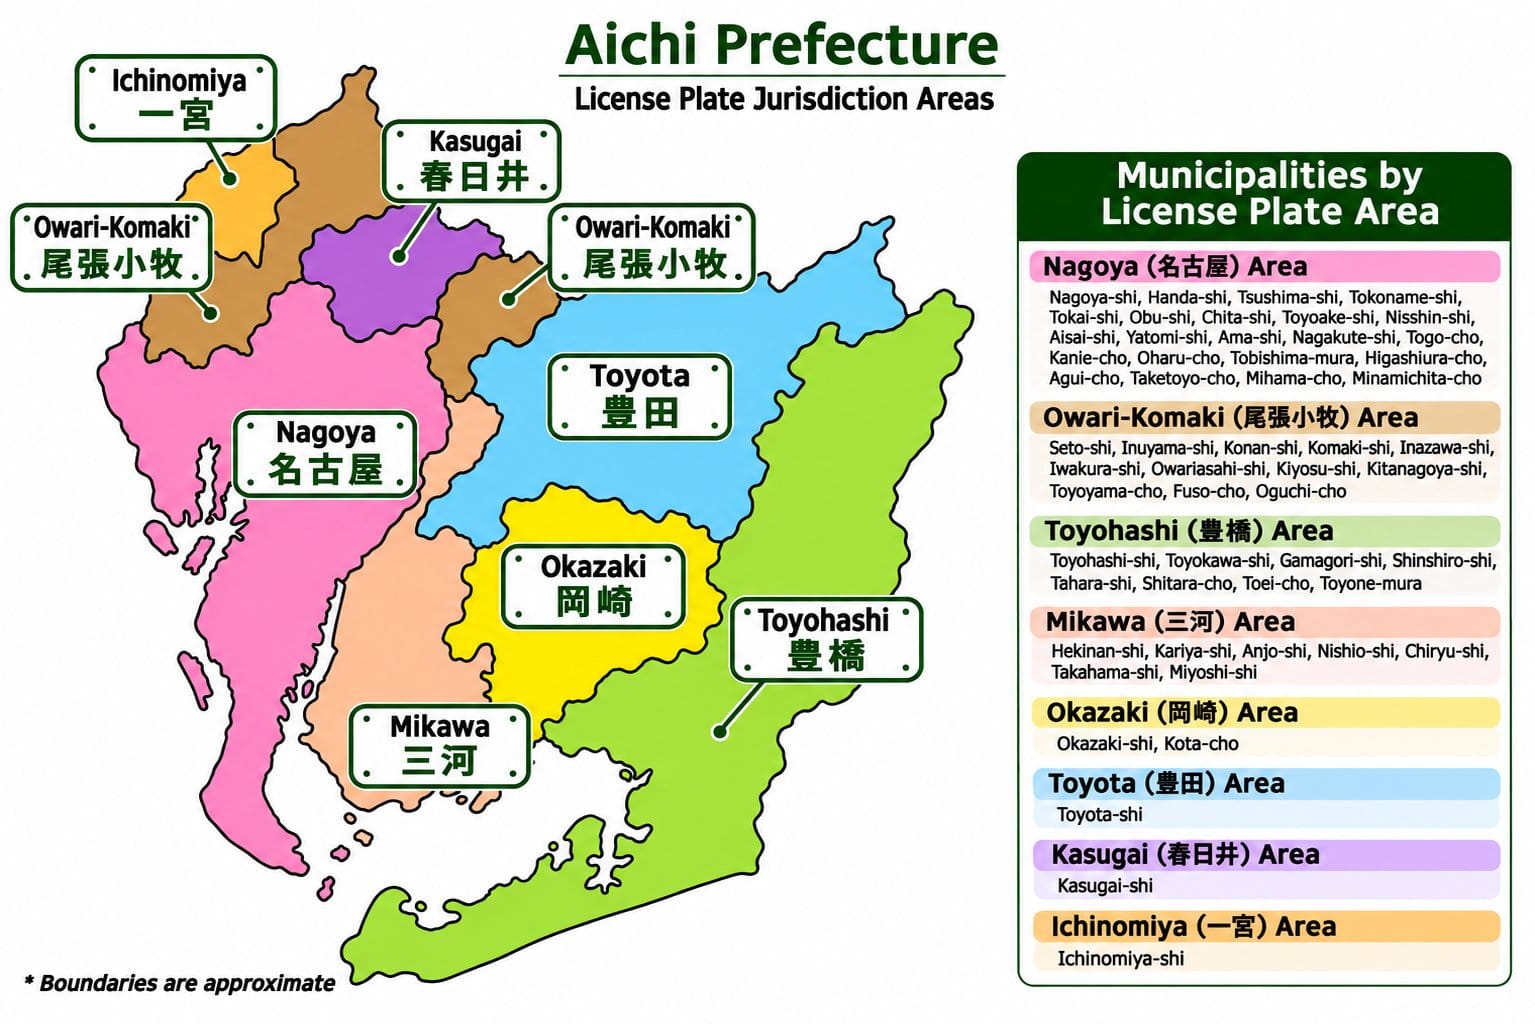
Confirmation bias may help explain one of the stereotypes. Owari-Komaki plates are conspicuous because they contain four kanji (尾張小牧). License plates with four kanji are extremely rare in Japan. Other than Owari-Komaki, the only license plate displaying four kanji is Ise-Shima, and that only became a license plate jurisdiction in 2020. If someone sees a bad driver, their eye might easily catch the unique plate and they might subconsciously take note of it. Owari-Komaki drivers may be getting a bad rap due to how easy it is to notice them.
Overall, Aichi does have its fair share of bad drivers and accidents, but the numbers do not point to it being the worst in the country. News media should consider more meaningful comparisons such as vehicle ownership, in addition to other relevant statistics. The thing I would watch out for is Nagoya's center bus lane roads. Definitely be careful driving on them if it is your first time doing so.
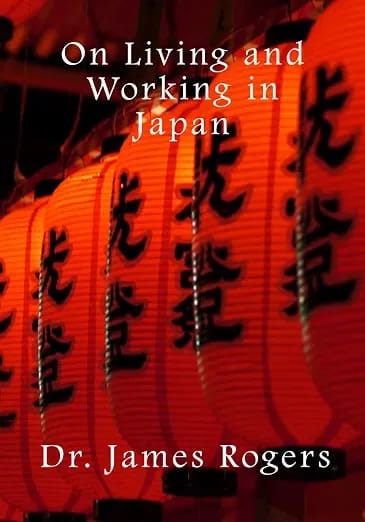
Dr. James Rogers is a tenured university professor who has published multiple books and over 50 articles on linguistics and Japanese studies. He is the author of the book "On Living and Working in Japan."



Leave a Comment